

Lead Generation Strategy & Results:
VIEWS GROWTH
Verbal Judo Institute, Inc. is a training organization teaching de-escalation and tactical communication skills to law enforcement, professionals and the public. In July 2026, a stepped-up posting schedule grew Verbal Judo Institute’s Instagram views 47% and new followers 2.6x over June, while Facebook link clicks more than doubled to 236.
Executive Summary
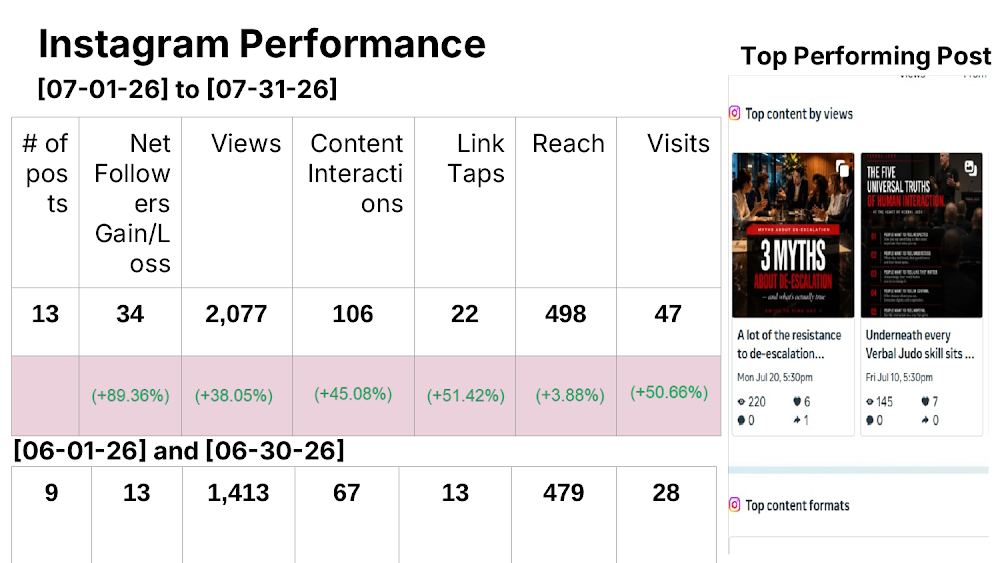
Across Instagram, Facebook and LinkedIn, July’s more consistent posting schedule produced stronger engagement on every channel. Instagram views rose 47.0% to 2,077, net new followers increased from 13 to 34, and content interactions grew 58.2%.
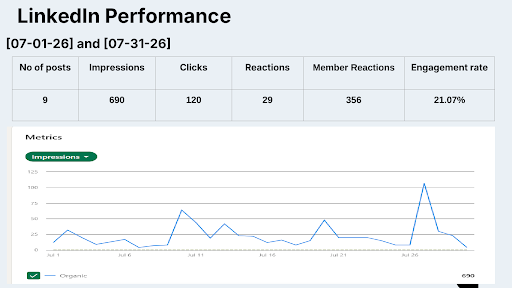
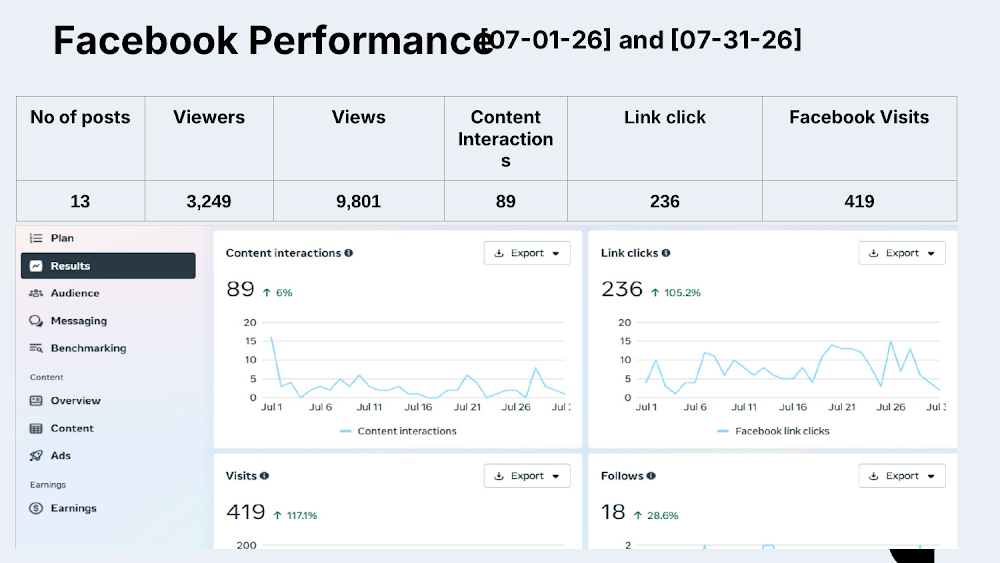
On Facebook, views held steady at 9,801 (+1.8%), while link clicks rose 105.2% to 236 and page visits rose 117.1% to 419. On LinkedIn, 9 posts generated 690 impressions, 120 clicks and a 21.07% engagement rate.
Social channels also sent 88 users to the website in July (87 from Facebook and 1 from LinkedIn), giving the brand a clear next opportunity: turning those visits into training inquiries.
Performance at a Glance
| Metric | July 2026 | Change | Outcome |
|---|---|---|---|
| Instagram Views | 2,077 | +47.0% | Growth |
| Instagram New Followers | 34 | Up from 13 | Audience growth |
| Instagram Content Interactions | 106 | +58.2% | Engagement |
| Facebook Views | 9,801 | +1.8% | Reach |
| Facebook Link Clicks | 236 | +105.2% | Traffic to website |
| Facebook Page Visits | 419 | +117.1% | Brand interest |
| LinkedIn Engagement Rate | 21.07% | — | Engagement |
| Posts Published | 13 Instagram & Facebook, 9 LinkedIn | Up from 9 on Instagram | Content consistency |
| Website Users from Social | 88 | 87 Facebook, 1 LinkedIn | Referral traffic |
The Challenge
Verbal Judo’s message, calm and respectful communication under pressure, needs to reach trainers, officers and professionals who rarely discover it on their own. In June, the brand posted only 9 times on Instagram and gained 13 followers. It needed more consistent, more shareable content to grow awareness and send people to the website.
What Drove the Result
- Output increased to 13 posts on Instagram and Facebook, plus 9 on LinkedIn.
- A branded content series was built around practical communication principles: myths about de-escalation, the five universal truths of human interaction, what to say when you don’t know what to say, and tone of voice.
- Bold, text-led graphics and carousels were designed to be saved and shared.
- Posts went out on a consistent evening schedule (5:30 pm) across platforms.
- The audience was grown by engaging local target users, competitors’ active followers and relevant hashtags.
Instagram Growth
Instagram views rose 47% and followers gained grew 2.6x over June. Every engagement metric grew faster than reach: the same audience engaged far more, and most of it is in New York, the brand’s core market.
| Instagram Metric | June | July | Change |
|---|---|---|---|
| Posts | 9 | 13 | +44.4% |
| Net New Followers | 13 | 34 | +161.5% |
| Views | 1,413 | 2,077 | +47.0% |
| Content Interactions | 67 | 106 | +58.2% |
| Link Taps | 13 | 22 | +69.2% |
| Profile Visits | 28 | 47 | +67.9% |
| Accounts Reached | 479 | 498 | +4.0% |
Facebook Engagement
Facebook reached fewer unique people, but each viewer did more: link clicks and page visits both more than doubled. Facebook also sent 87 users to the website in July (GA4).
| Facebook Metric | July | Change |
|---|---|---|
| Views | 9,801 | +1.8% |
| Viewers | 3,249 | −16.7% |
| Content Interactions | 89 | +6% |
| Link Clicks | 236 | +105.2% |
| Page Visits | 419 | +117.1% |
| New Follows | 18 | +28.6% |
LinkedIn Engagement
A 21.07% engagement rate is far above typical LinkedIn page benchmarks, showing the professional audience responds strongly to Verbal Judo’s content.
| LinkedIn Metric | July |
|---|---|
| Posts | 9 |
| Impressions | 690 |
| Clicks | 120 |
| Reactions | 29 |
| Engagement Rate | 21.07% |
Top-Performing Content
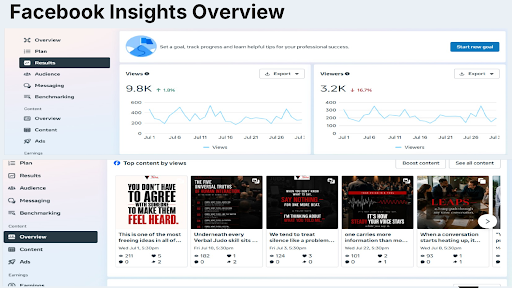
Posts that state one clear, slightly contrarian communication principle performed best on both platforms. “The Five Universal Truths” ranked in the top two on both Instagram and Facebook, showing that the core Verbal Judo framework works well across audiences.
| Post | Platform | Date | Views |
|---|---|---|---|
| 3 Myths About De-escalation | Jul 20 | 220 | |
| You Don’t Have to Agree With Someone to Make Them Feel Heard | Jul 1 | 211 | |
| The Five Universal Truths of Human Interaction | Jul 10 | 182 | |
| The Five Universal Truths of Human Interaction | Jul 10 | 145 | |
| When You Don’t Know What to Say, Say Nothing | Jul 3 | 124 |
Website Traffic & Business Impact
Higher engagement translated into more people moving from social to the website. Facebook link clicks rose 105.2% to 236, Instagram link taps rose 69.2% to 22, and social channels sent 88 users to the website in July (87 from Facebook and 1 from LinkedIn). No conversions were recorded from this traffic yet, so the next priority is linking posts to a clear training or booking page.
Case Study Takeaways
- Raising output to 13 posts on Instagram and Facebook grew Instagram views 47% and new followers 2.6x over June.
- Every Instagram engagement metric grew faster than reach, with interactions up 58.2%, profile visits up 67.9% and link taps up 69.2% against a 4.0% rise in accounts reached.
- Facebook link clicks (+105.2%) and page visits (+117.1%) more than doubled, even as unique viewers fell 16.7%.
- LinkedIn posts earned a 21.07% engagement rate, far above typical LinkedIn page benchmarks.
- Posts that state one clear, slightly contrarian communication principle performed best, and “The Five Universal Truths” ranked in the top two on both platforms.
- Social sent 88 users to the website in July, setting up the next goal of turning visits into training inquiries.
Next Steps
- Boost one or two top-performing posts each week, budget permitting, to widen reach beyond the current audience.
- Keep growing followers by engaging local target users, competitors’ active followers and relevant hashtags.
- Turn website visits into inquiries by linking posts to a clear training or booking page.
Performance figures are based on Instagram and Facebook insights (Meta Business Suite), LinkedIn page analytics and Google Analytics 4 for Jul 1–31, 2026, compared with Jun 1–30, 2026 where available. Social platform metrics and definitions can vary by platform and reporting tool.